# prepare data
df_serum <- read_excel("./Serum.xlsx") %>% as_tibble() %>% pivot_longer(cols=CHIT1:IL8, names_to='Cytokines', values_to='value') %>% mutate(ID=as.character(ID)) %>% mutate(Cytokines = factor(Cytokines,levels = c("IL8","TNFα","ITAC","S100A8","CHIT1")))
# IL-8 (IL8)
# TNF-α (TNFα)
# ITAC
# S100A8
# CHIT1
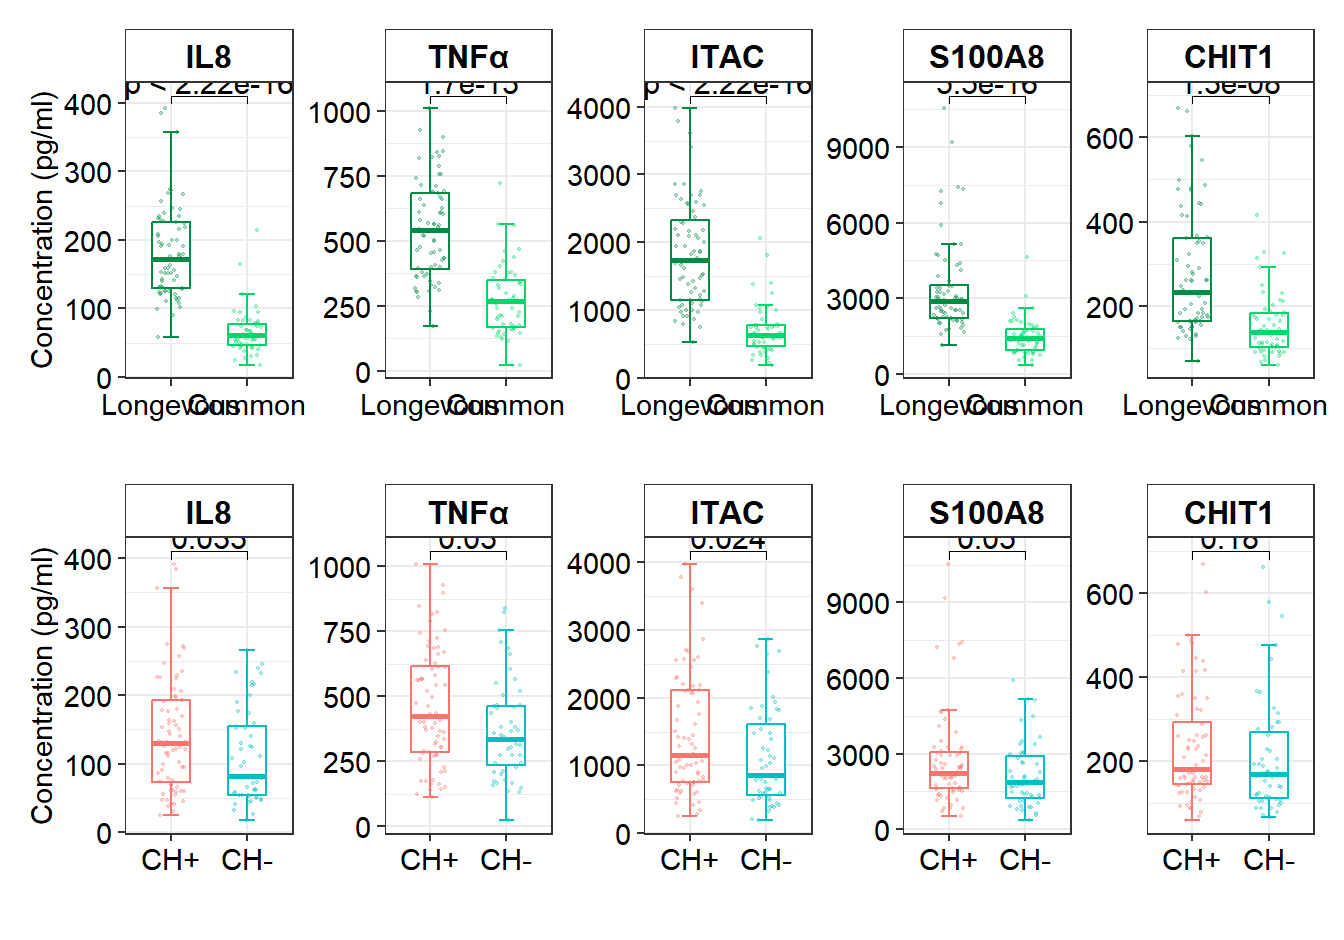
# Figure 3A Cytokines and age group
df_box1 <- df_serum %>% mutate(age_group=ifelse(Age>=90,"Longevous","Common")) %>%  mutate(age_group=factor(age_group,levels = c("Longevous","Common")))

# plot
Cytokines_Age=ggplot(df_box1,aes(x=age_group, y=value,color=age_group)) +
    stat_boxplot(geom="errorbar",position=position_dodge(width=0.2),width=0.2,size=0.5) +
    geom_boxplot(aes(),notch = F,size=0.5,width=0.5,outlier.shape=NA) +
    geom_jitter(size = 0.4,alpha = 0.3,width = 0.2) +
    theme_bw() +
    theme(axis.text = element_text(colour='black',size=9)) +
    labs(x="", y="Concentration (pg/ml)")+
    facet_wrap(~Cytokines, scales = "free_y", ncol = 5) +
    theme(strip.background = element_rect(fill=c("white"))) +
    theme(strip.text = element_text(size = 12,face = 'bold',colour = "gray2")) +
    theme(axis.text=element_text(colour='black',size = 11),legend.position ="none") +
    stat_compare_means(comparisons = list(c("Longevous", "Common")), method = "wilcox.test", label = "p.format", size = 4) +
    scale_color_manual(values = c("Longevous" = "springgreen4", "Common" = "#00D66B"), guide = FALSE)

#file.path(outdir,"Cytokines_Age.pdf") %>% ggsave(Cytokines_Age,width=10,height=3)

# Figure 3B Cytokines and CH+/CH-
df_box2 <- df_serum %>% mutate(CH=ifelse(CH==1,"CH+","CH-")) %>% mutate(CH=factor(CH,levels = c("CH+","CH-")))

# plot
Cytokines_ch=ggplot(df_box2,aes(x=CH, y=value,color=CH)) +
    stat_boxplot(geom="errorbar",position=position_dodge(width=0.2),width=0.2,size=0.5) +
    geom_boxplot(aes(),notch = F,size=0.5,width=0.5,outlier.shape= NA) +
    geom_jitter(size = 0.4,alpha = 0.3,width = 0.2) +
    theme_bw() +
    theme(axis.text=element_text(colour='black',size=9)) +
    labs(x="", y="Concentration (pg/ml)", color = "CH",fill = "CH") +
    facet_wrap(~Cytokines, scales = "free_y", ncol = 5) +
    theme(strip.background = element_rect(fill=c("white"))) +
    theme(strip.text = element_text(size = 12,face = 'bold',colour = "gray2")) +
    theme(axis.text=element_text(colour='black',size = 11),legend.position ="none")+
    stat_compare_means(comparisons = list(c("CH-", "CH+")), method = "wilcox.test", size = 4)

# Figure 3A and 3B saved into a file 'Cytokines_Age_CH.pdf'
Cytokines_both <- list(Cytokines_Age,Cytokines_ch) %>% wrap_plots(nrow=2, heights =c(1,1))
file.path(outdir,"Cytokines_Age_CH.pdf") %>% ggsave(Cytokines_both,width=10,height=7)