5 Figure 1. Clonal hematopoiesis in longevous elderly group and common elderly group.
5.1 Barplot for CH
# Figure 1A
# prepare data
df_ch <- df_full %>% mutate(CH=ifelse(is.na(vaf),'N','Y')) %>% select(ID,Age,agrp,lngv,CH) %>% arrange(desc(CH)) %>% distinct(ID,Age,agrp,lngv,.keep_all=T)

# gp_ch
df_tmp_ch <- df_ch %>% count(agrp) %>% rename(total=n)
df_ch_freq <- df_ch %>% count(CH,agrp) %>% inner_join(df_tmp_ch, by='agrp') %>% mutate(freq=n/total) %>% mutate(agrp=factor(agrp,levels=c("[60,70)","[70,80)","[80,90)","[90,100)","[100,+)")))
p <- df_ch_freq %>% ggplot(aes(x=freq, y=agrp, fill=CH))
gp_ch <- p + geom_bar(stat="identity", width=0.8) + scale_fill_brewer(palette=1) + theme_classic() + xlab('Frequency') + ylab('Age group')

# Figure 1C
# gp_ch_num
df_total <- df_ch %>% count(lngv) %>% rename(total=n)
df_ch_num <- df_ch %>% count(CH,lngv) %>% inner_join(df_total,by="lngv") %>% mutate(freq=n/total)
p <- df_ch_num %>% ggplot(aes(x=lngv, y=freq, fill=CH))
gp_ch_num <- p + geom_bar(stat="identity", width=0.5) + scale_fill_brewer(palette=1) + theme_classic() + xlab('') + ylab('Frequency')

# Figure 1A and 1C saved into a file 'Barplot_CH_age.pdf'
gp_both_ch <- list(gp_ch,gp_ch_num) %>% wrap_plots(ncol=2, widths=c(2,1), guides="collect")
file.path(outdir,"Barplot_CH_age.pdf") %>% ggsave(gp_both_ch, width=9, height=3)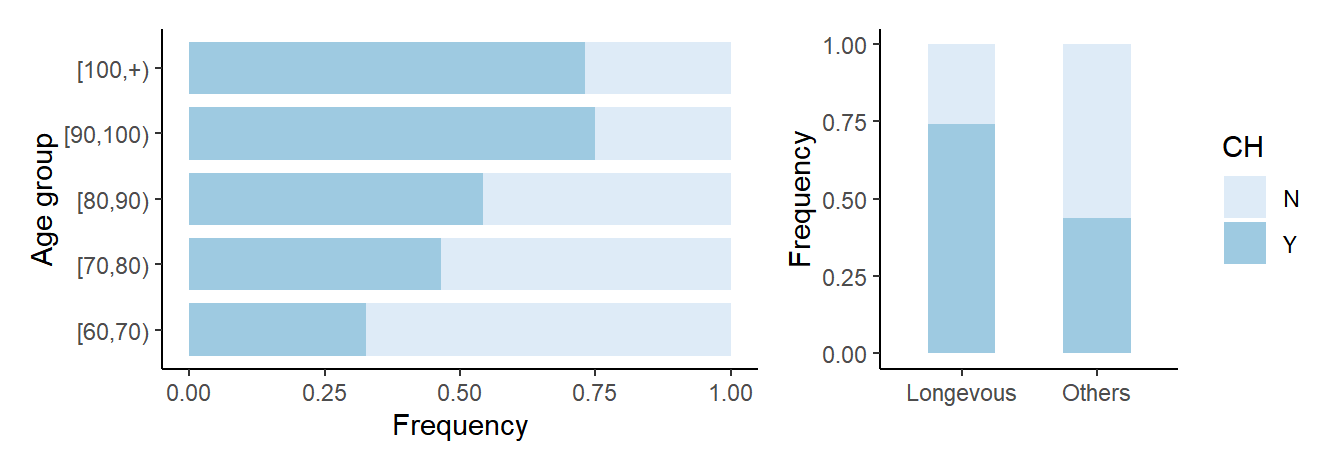
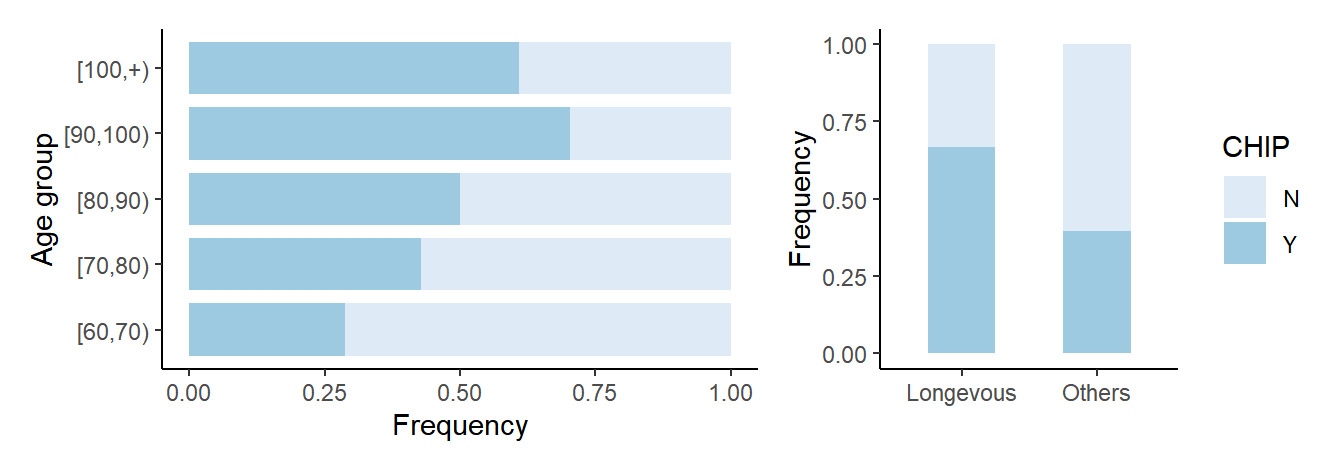
5.2 Barplot for CHIP
# Figure 1B
# prepare data
df_chip <- df_full %>% mutate(CHIP=ifelse(is.na(vaf) | vaf<2,'N','Y')) %>% select(ID,Age,agrp,lngv,CHIP) %>% arrange(desc(CHIP)) %>% distinct(ID,Age,agrp,lngv,.keep_all=T)

# gp_chip
df_tmp_chip <- df_chip %>% count(agrp) %>% rename(total=n)
df_chip_freq <- df_chip %>% count(CHIP,agrp) %>% inner_join(df_tmp_chip, by='agrp') %>% mutate(freq=n/total) %>% mutate(agrp=factor(agrp,levels=c("[60,70)","[70,80)","[80,90)","[90,100)","[100,+)")))
p <- df_chip_freq %>% ggplot(aes(x=freq, y=agrp, fill=CHIP))
gp_chip <- p + geom_bar(stat="identity", width=0.8) + scale_fill_brewer(palette=1) + theme_classic() + xlab('Frequency') + ylab('Age group')

# Figure 1D
# gp_chip_num
df_chip_num <- df_chip %>% count(CHIP,lngv) %>% inner_join(df_total,by="lngv") %>% mutate(freq=n/total)
p <- df_chip_num %>% ggplot(aes(x=lngv, y=freq, fill=CHIP))
gp_chip_num <- p + geom_bar(stat="identity",width=0.5) + scale_fill_brewer(palette=1) + theme_classic() + xlab('') + ylab('Frequency')

# Figure 1B and 1D saved into a file 'Barplot_CHIP_age.pdf'
gp_both_chip <- list(gp_chip,gp_chip_num) %>% wrap_plots(ncol=2, widths=c(2,1), guides="collect")
file.path(outdir,"Barplot_CHIP_age.pdf") %>% ggsave(gp_both_chip, width=9, height=3)